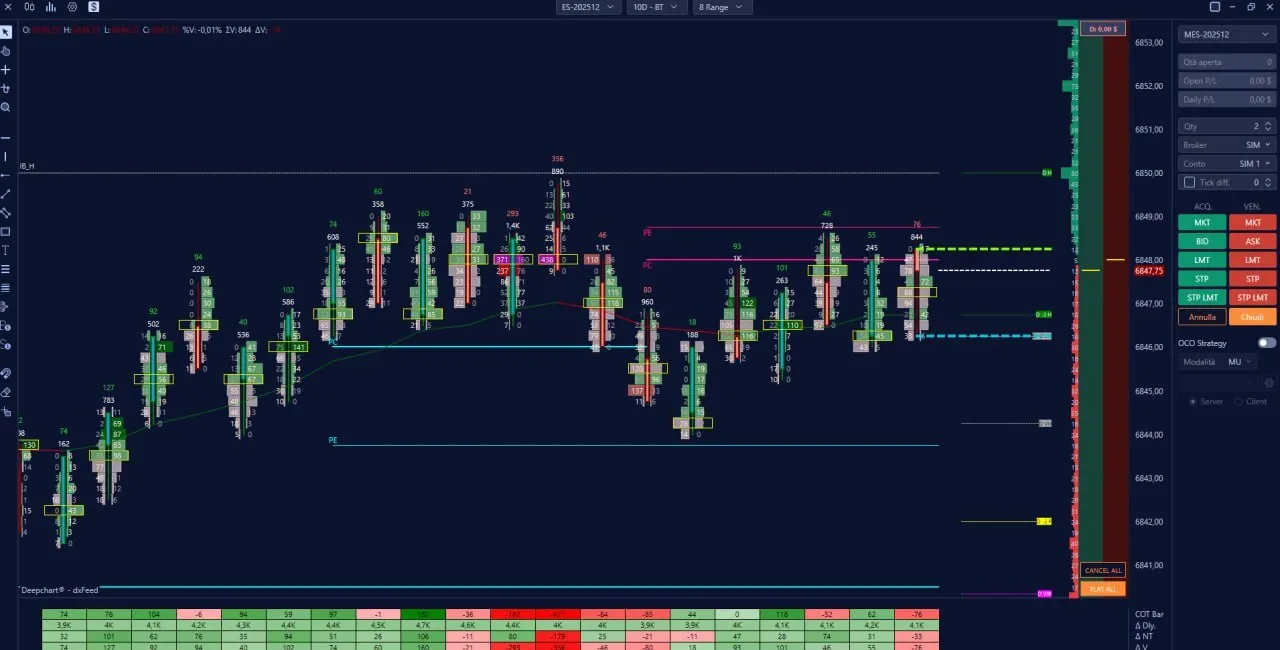
Footprint charts
Every bar opened up: what traded at the bid and at the ask at each price, shaded by size so the busy prices stand out.
In DeepCharts and ATAS
 Stratton Orderflow
What the three apps show you. Each feature has a page of its own, with a picture of it, and says which apps have it.
Every bar opened up: what traded at the bid and at the ask at each price, shaded by size so the busy prices stand out.
In DeepCharts and ATAS
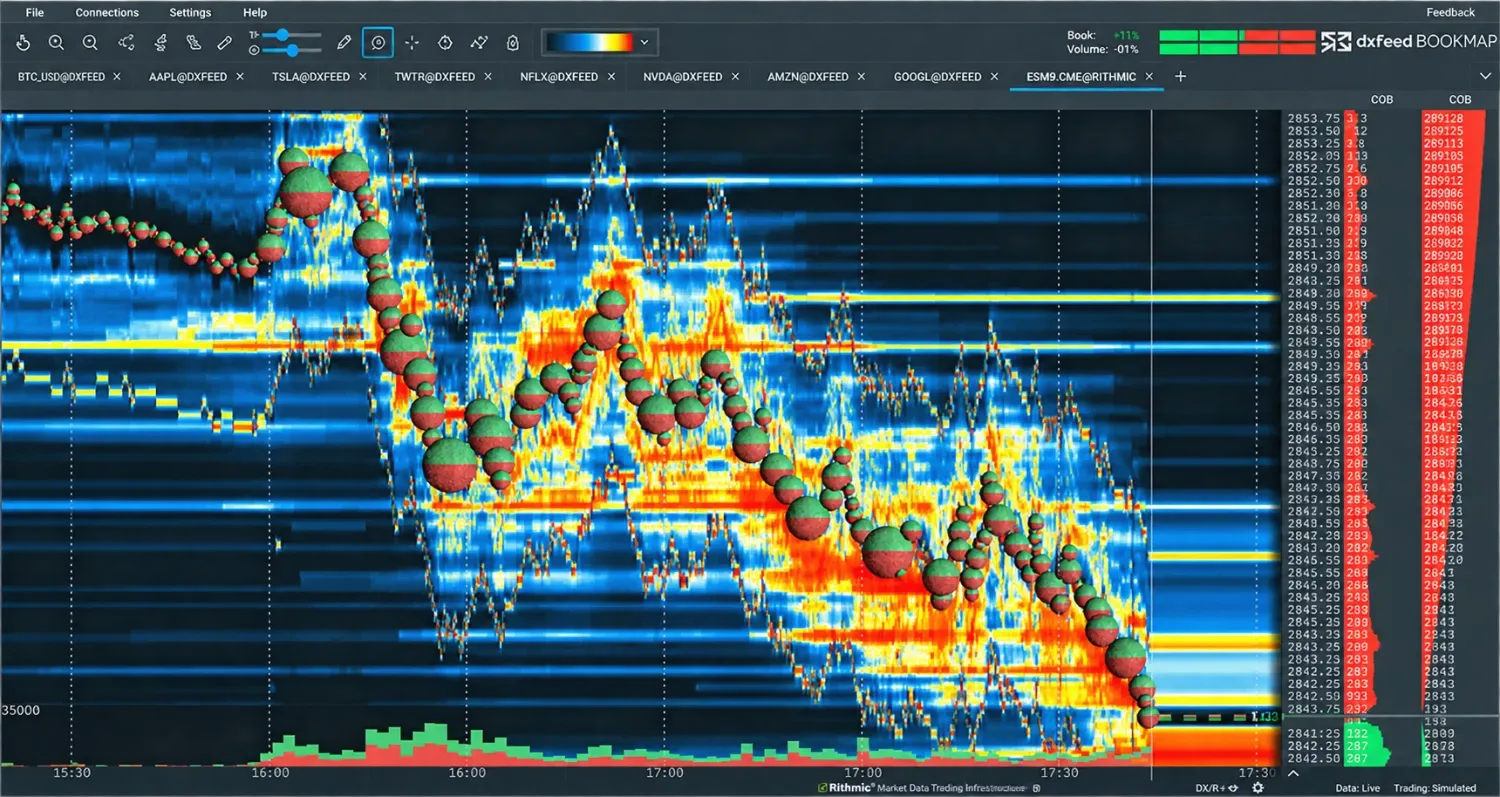
The limit orders waiting above and below the price, drawn over time, so you see where liquidity sat, moved or was pulled.
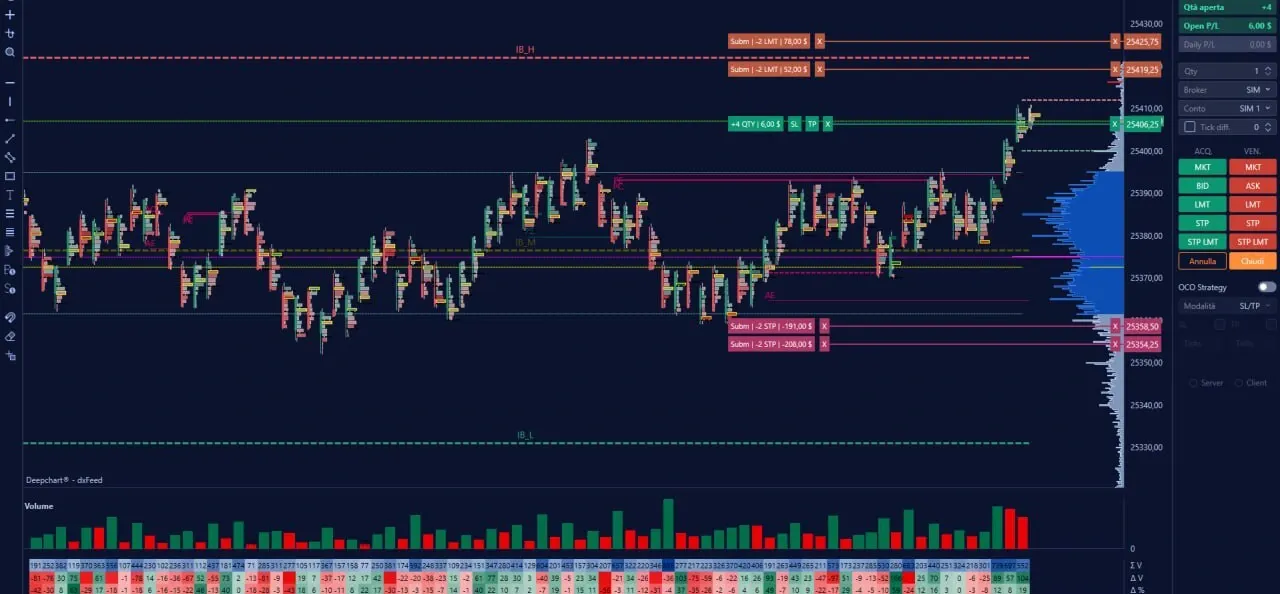
How much traded at each price over a session, as a bar beside the price, so the busiest prices stand out.
In DeepCharts and Bookmap
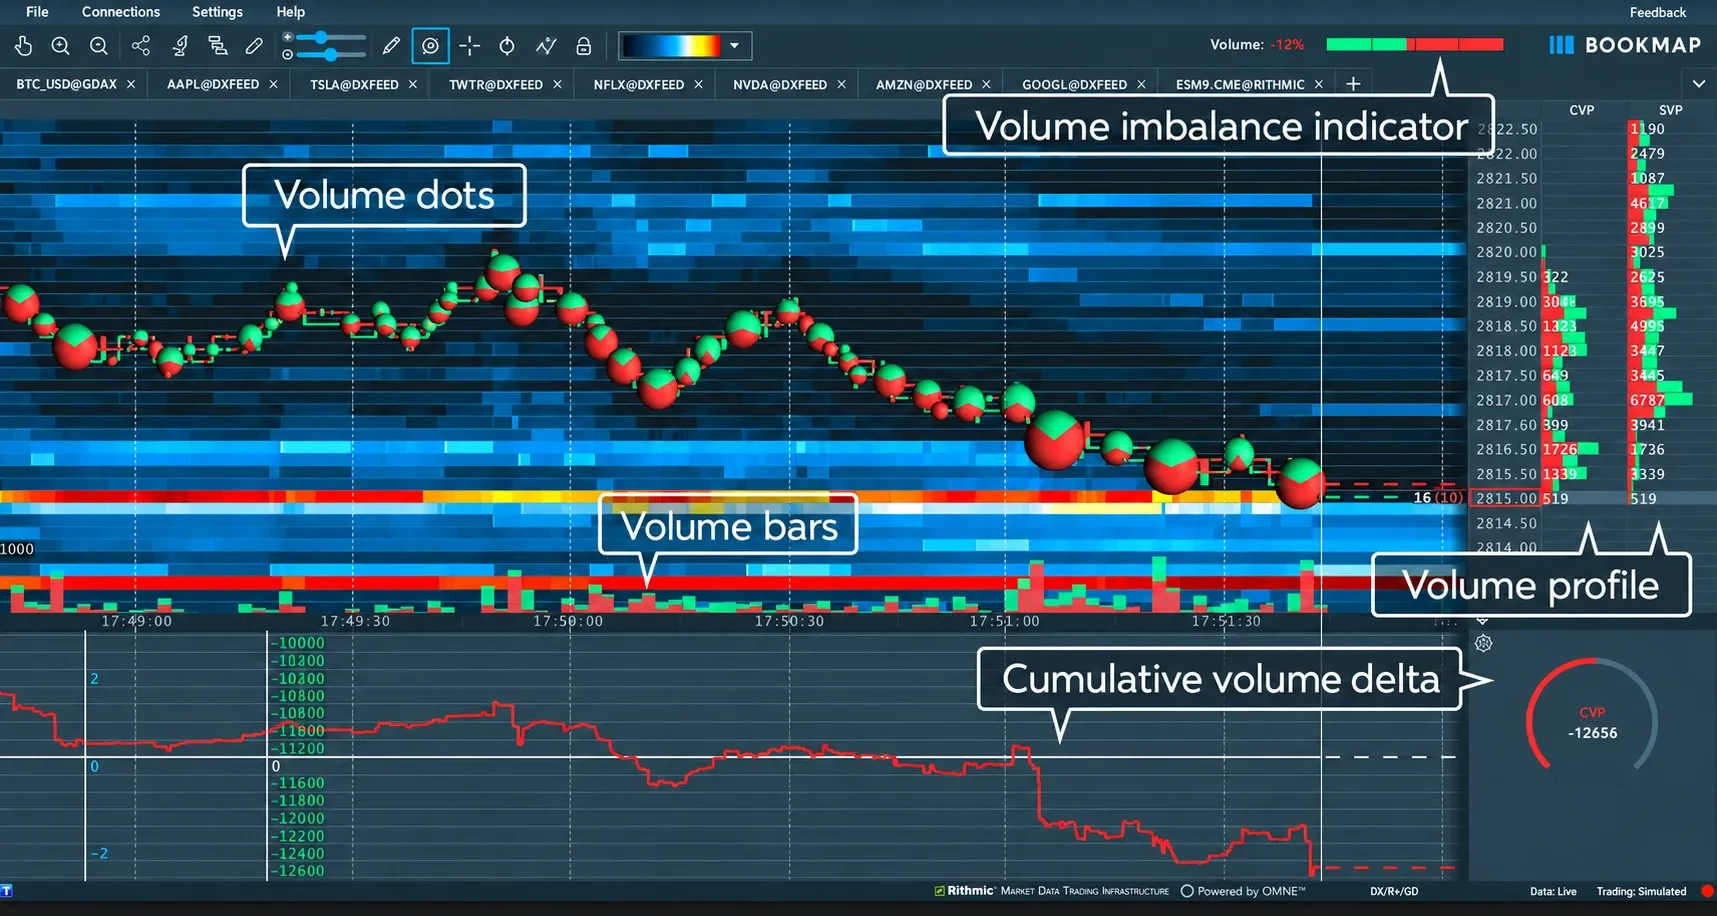
Buying at the ask minus selling at the bid, bar by bar and added up through the day, right under the price.
In DeepCharts, ATAS and Bookmap
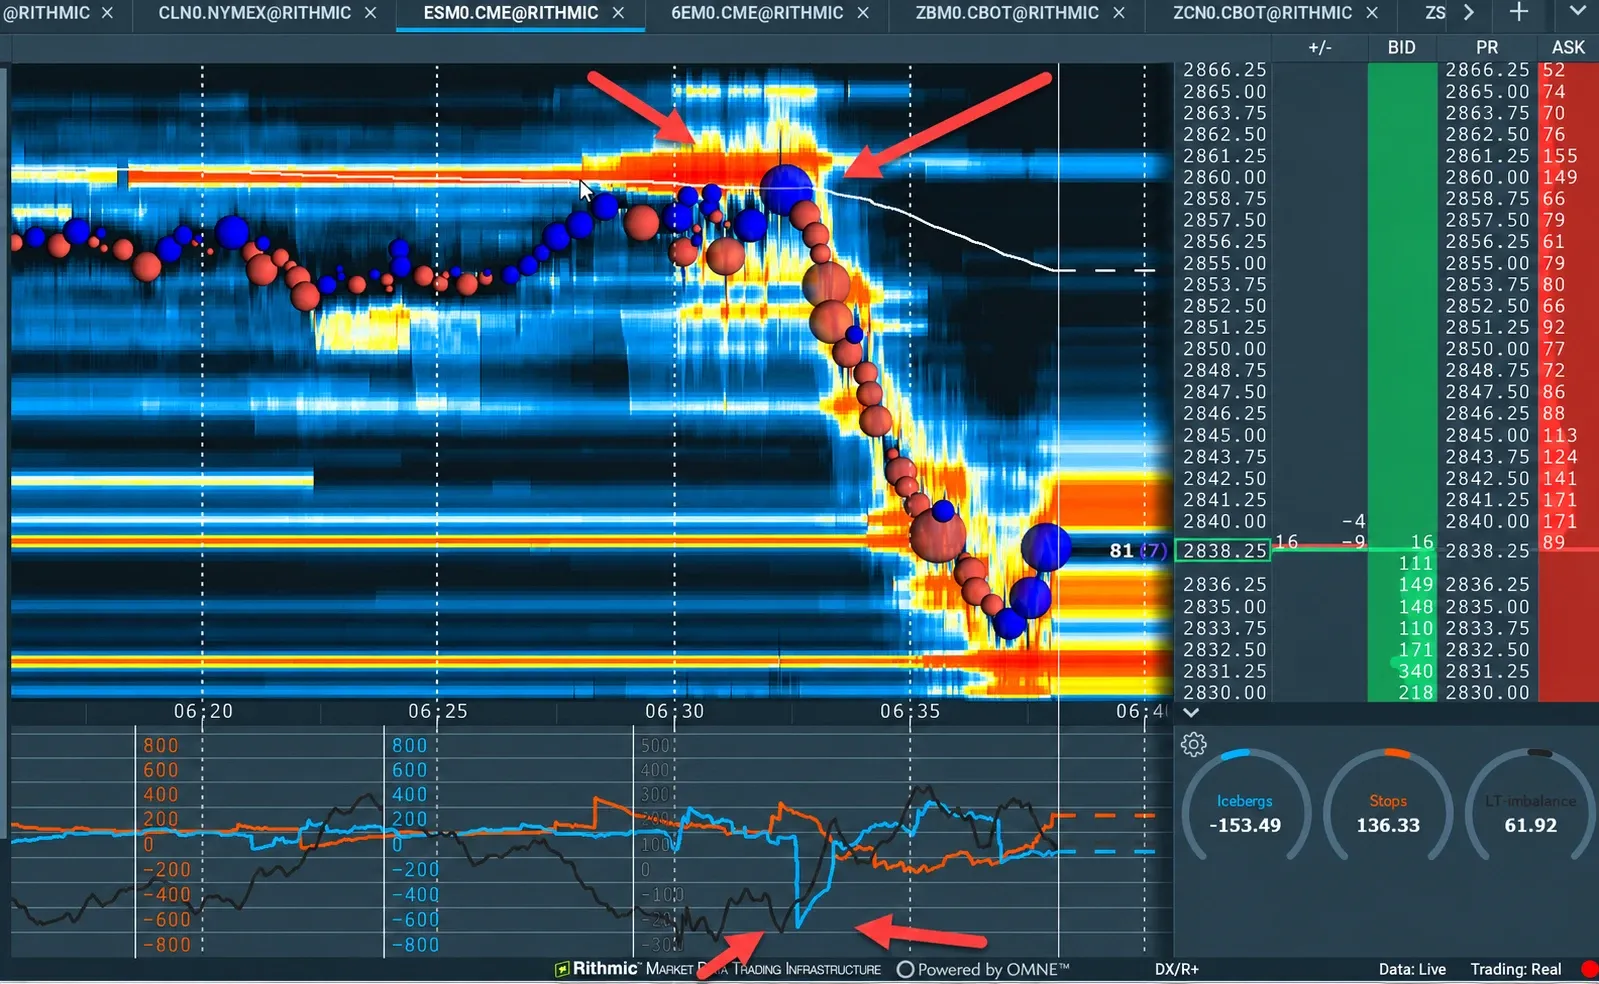
Price running through a cluster of stops, seen on the heatmap as it happens, with a gauge reading the stops beside it.
In Bookmap
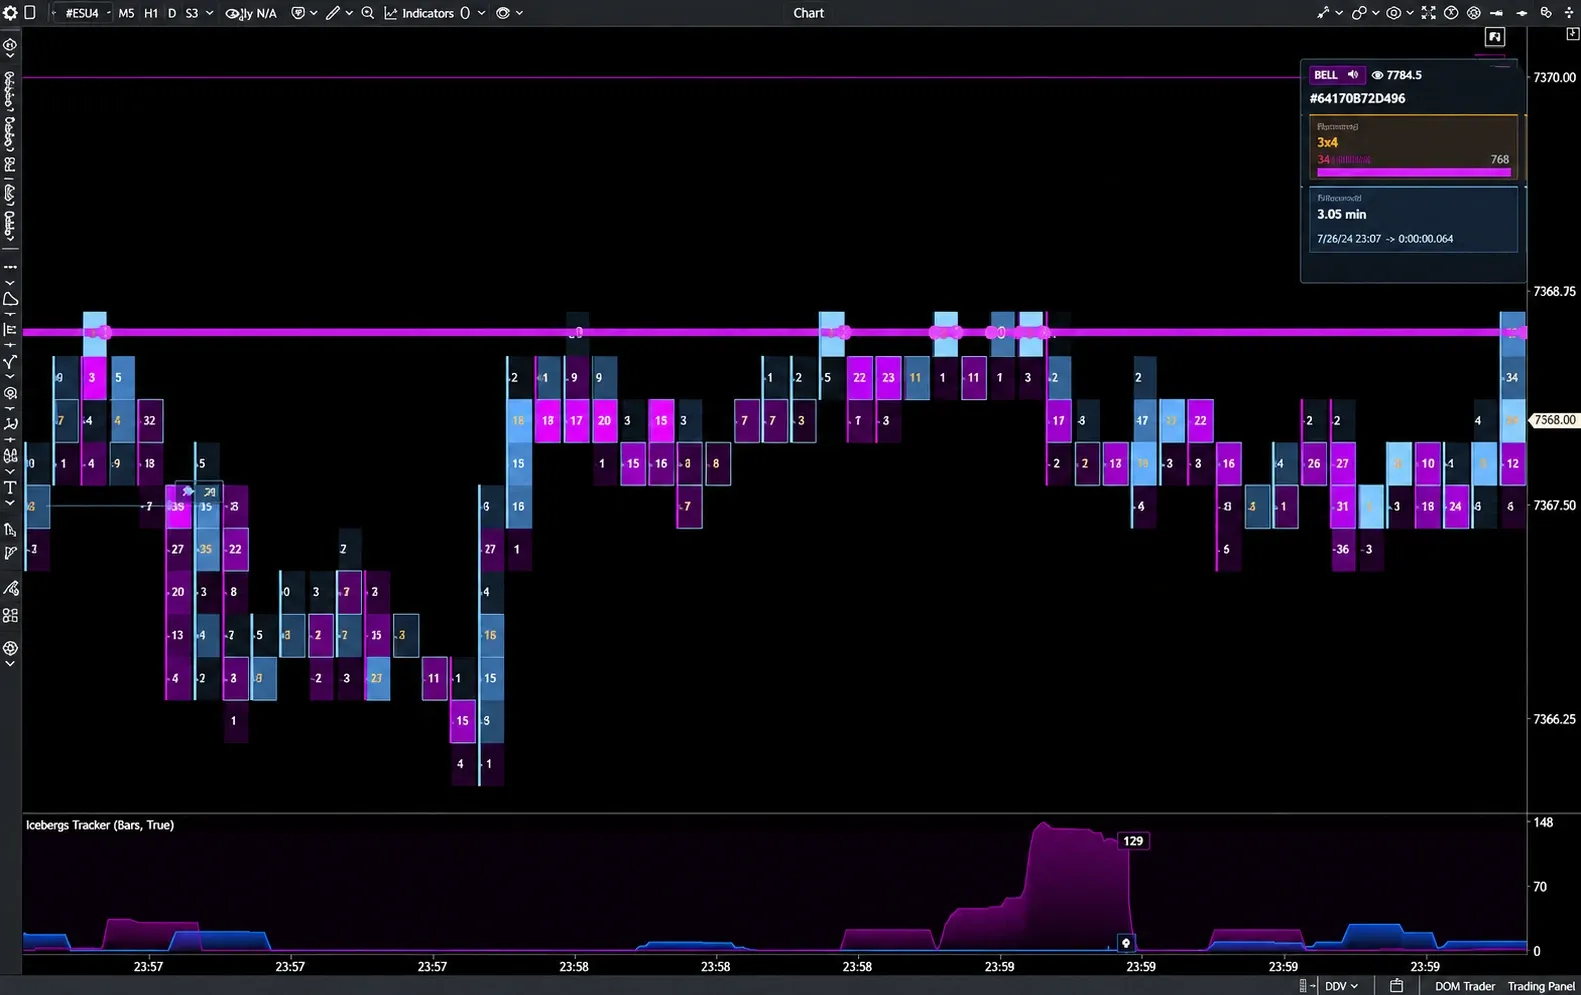
Finds large orders hiding behind small visible ones, and marks them while they are still working.