Footprint charts
Every bar opened up: what traded at the bid and at the ask at each price, shaded by size so the busy prices stand out.
In DeepCharts and ATAS
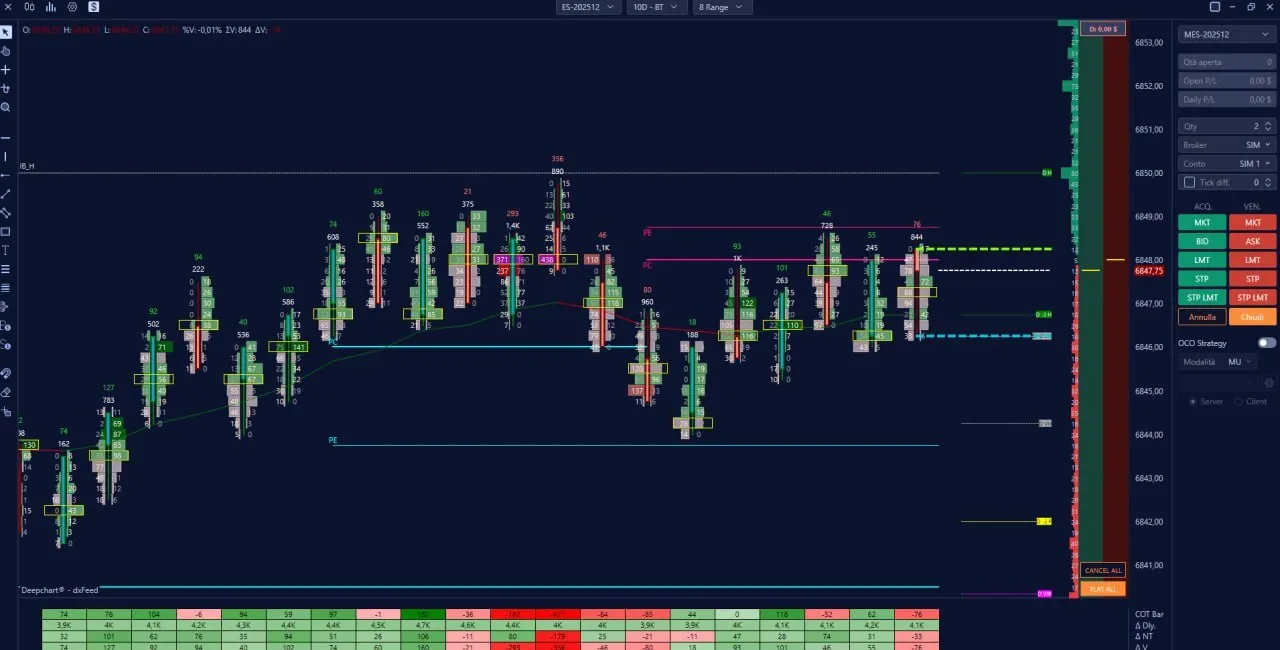
Shown here in DeepCharts.
What it does
A candle shows where price went. A footprint shows how it got there: each bar is split into its prices, and each price shows the contracts sold at the bid and bought at the ask. The heavier the trading, the brighter the cell, so the prices where one side took over stand out without reading every number.
Who it's for
For traders who want to see which side was pushing inside each bar.